Secondary 5 Statistics Worksheet — Z-Scores and Voting Methods
Three things, and the exam asks for all of them: reading a survey critically — population, sample, sampling method, type of variable, measures of dispersion — standardising a result with a z-score so that marks from two different groups can be compared, and running one set of ballots through several voting procedures to see why they disagree. The voting questions are where the argument matters more than the arithmetic. Read them on this page, or print the sheet; it costs nothing and no account is involved.
Practice worksheet — free PDF
No email, no account, no watermark. Teachers: photocopy it for your classes freely. Worked solutions and 6 harder problems come with the Secondary 5 Math bundle.
4 of the 6 questions
Each question targets one named concept from the sheet. Read them here, or print the PDF — it has working space under each one. 4 of the 6 questions are printed below. The other 2 are built on a diagram or a table of values that does not translate to the page, so they are in the free PDF — marked below where they would have come.
-
Q1Statistics
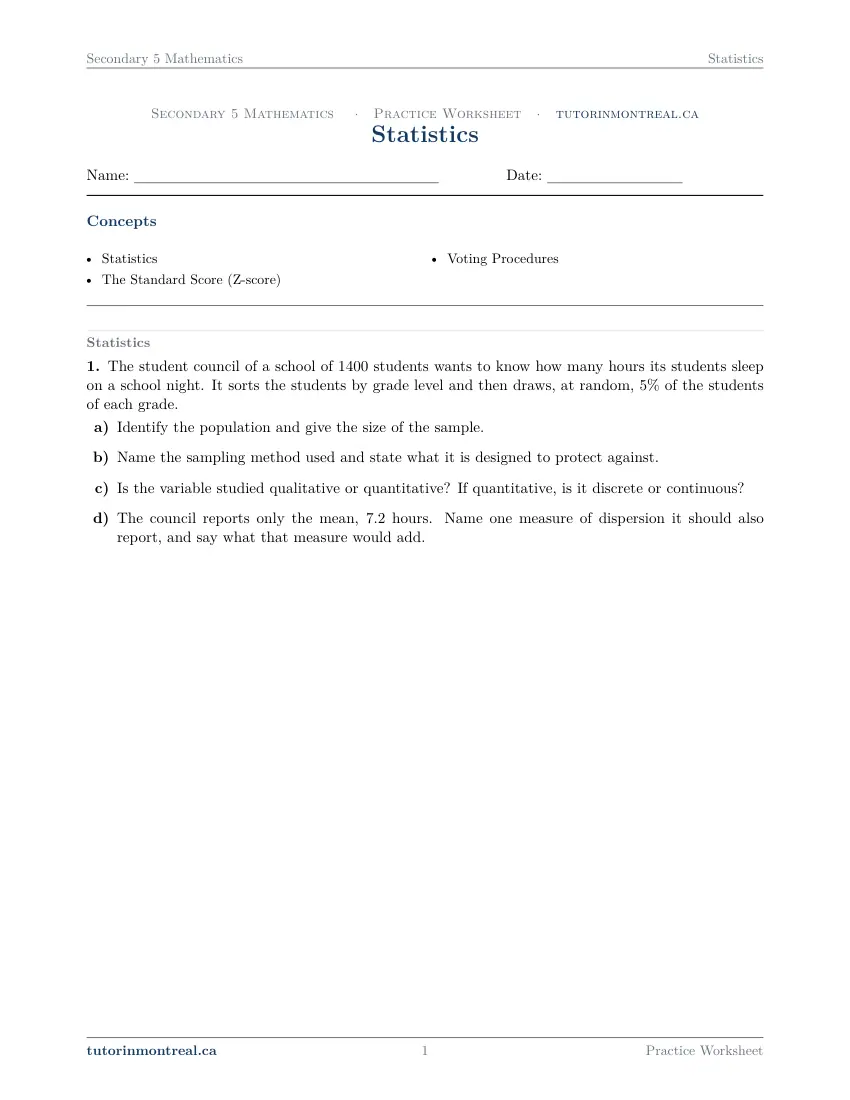
The student council of a school of 1400 students wants to know how many hours its students sleep on a school night. It sorts the students by grade level and then draws, at random, of the students of each grade.
- Identify the population and give the size of the sample.
- Name the sampling method used and state what it is designed to protect against.
- Is the variable studied qualitative or quantitative? If quantitative, is it discrete or continuous?
- The council reports only the mean, 7.2 hours. Name one measure of dispersion it should also report, and say what that measure would add.
-
Q2The Standard Score (Z-score)
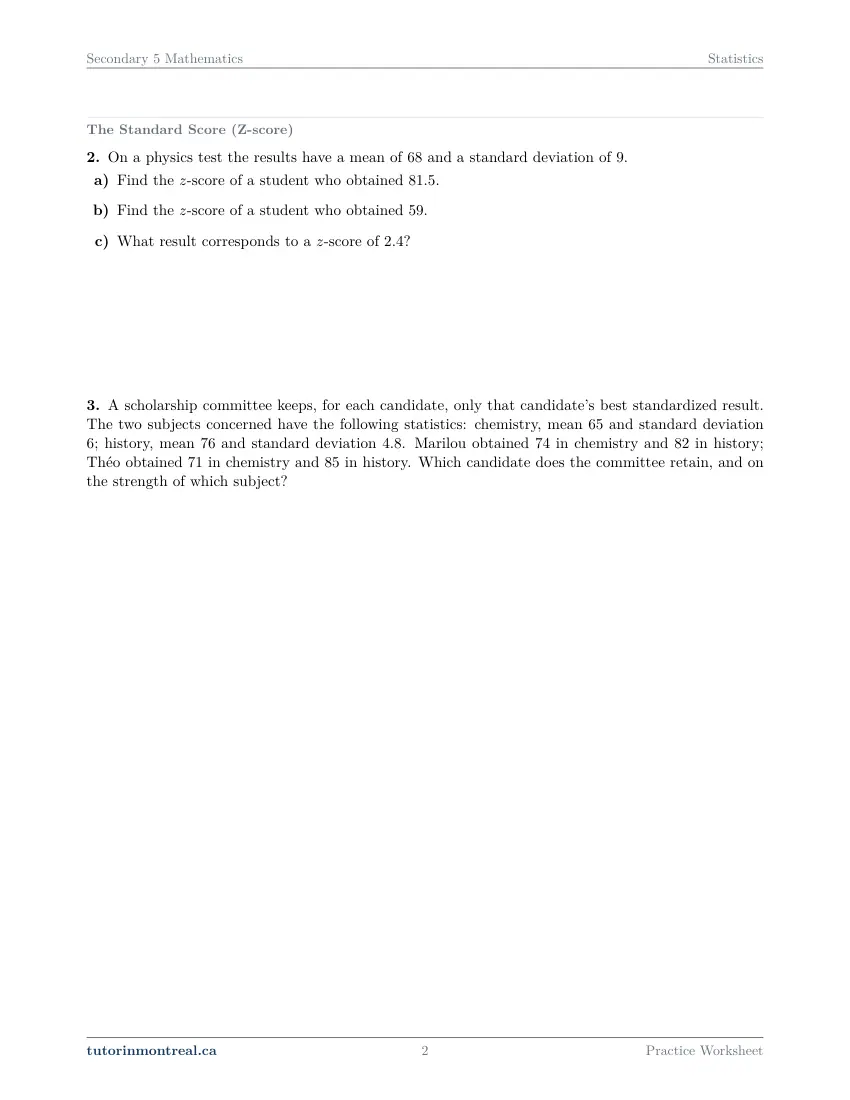
On a physics test the results have a mean of 68 and a standard deviation of 9.
- Find the -score of a student who obtained 81.5.
- Find the -score of a student who obtained 59.
- What result corresponds to a -score of ?
-
Q3The Standard Score (Z-score)
A scholarship committee keeps, for each candidate, only that candidate's best standardized result. The two subjects concerned have the following statistics: chemistry, mean 65 and standard deviation 6; history, mean 76 and standard deviation 4.8. Marilou obtained 74 in chemistry and 82 in history; Théo obtained 71 in chemistry and 85 in history. Which candidate does the committee retain, and on the strength of which subject?
-
Q4Voting Procedures
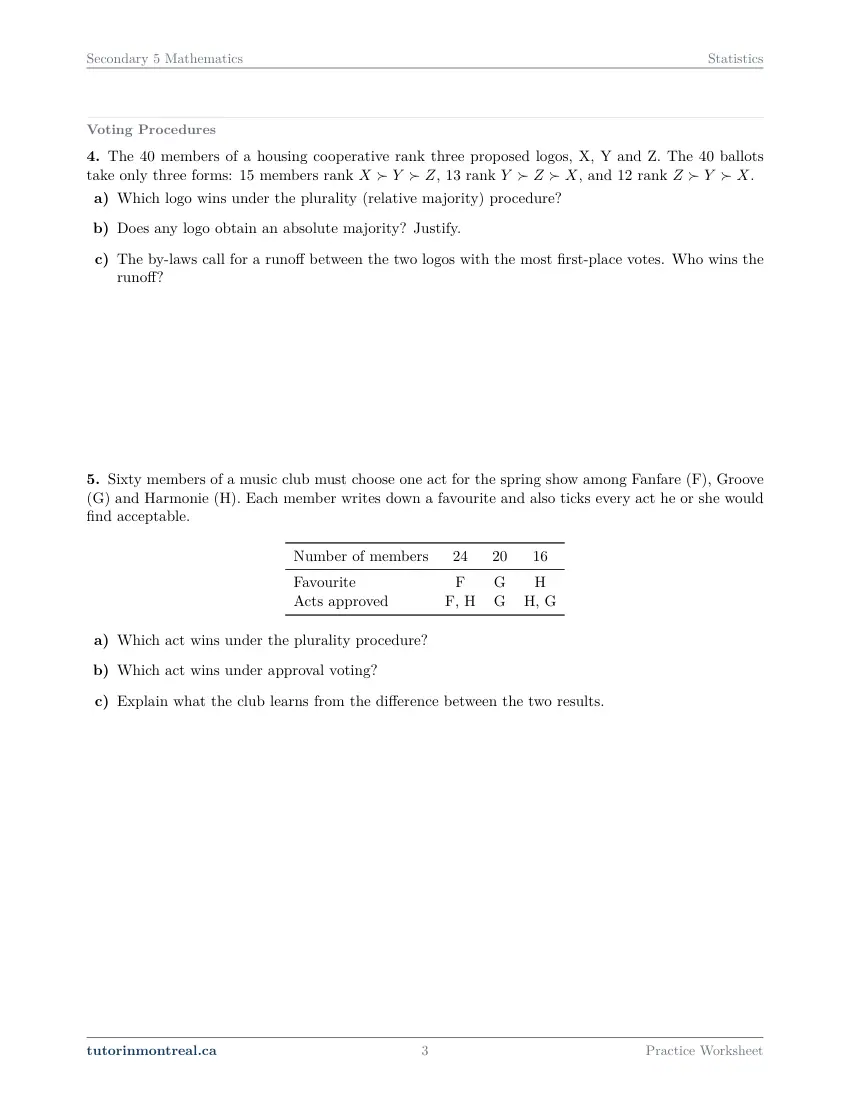
The 40 members of a housing cooperative rank three proposed logos, X, Y and Z. The 40 ballots take only three forms: 15 members rank , 13 rank , and 12 rank .
- Which logo wins under the plurality (relative majority) procedure?
- Does any logo obtain an absolute majority? Justify.
- The by-laws call for a runoff between the two logos with the most first-place votes. Who wins the runoff?
-
Q5Voting Procedures
This question is built around a diagram or a table of values. Open it in the PDF.
-
Q6Synthesis — drawing on several sheets in this topic
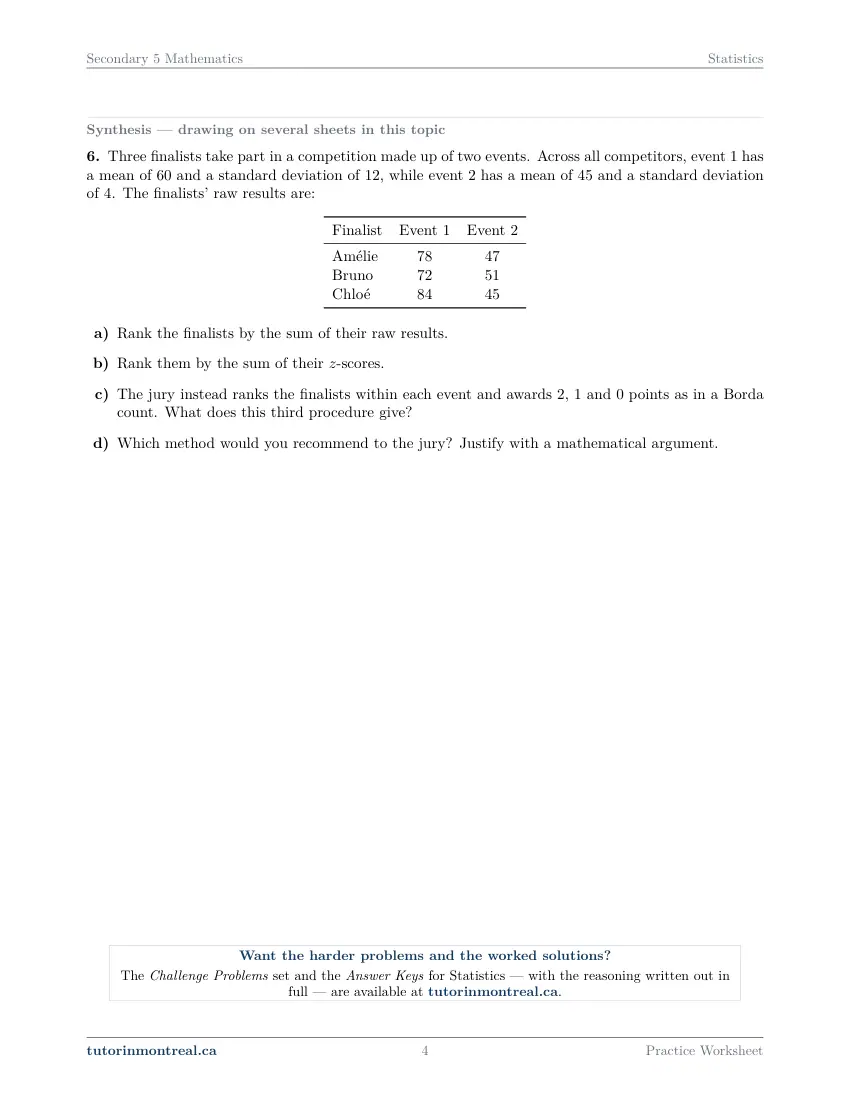
This question is built around a diagram or a table of values. Open it in the PDF.
The 6 challenge problems for this topic are a separate, paid sheet and are not reproduced here.
Which stream is this for? This sheet is built for SN. It assumes you can work with the mean and standard deviation of a distribution, standardise and de-standardise a result, and compare voting procedures on the same ballots, and it goes to the depth that program expects.
How to do every concept on this sheet
This is the part worksheet sites usually leave out. Below is the actual reasoning behind each group of questions — not a full solution set, the decisions that get you to one. Read it before you start, or after you get stuck.
Reading a survey: four words that must not be blurred (Q1)
The population is every unit you want to describe — here, all the students of the school, not the ones who answered. The sample is the subset actually surveyed, and when the question gives you a percentage you have to turn it into a count. The sampling method is how the sample was chosen, and the variable is what was measured on each unit.
Sorting the students by grade level and drawing the same proportion from each is stratified sampling — the strata are the grade levels. Saying "stratified" gets half the mark; the other half is saying what it protects against. Because every stratum is represented in proportion to its size, a group whose habits differ from the rest cannot be over- or under-represented by the luck of the draw. It does not protect against anything else: it is a guarantee about composition, not about honesty of answers or about non-response.
Quantitative or qualitative, discrete or continuous. Quantitative means the values are numbers you can do arithmetic on. Within that, discrete values can be listed one by one (a number of siblings), while continuous values can in principle fall anywhere in an interval. A duration is continuous even when everybody reports it to the nearest quarter hour — the rounding is a property of the reporting, not of the quantity. That is the distinction the question is testing.
The last part asks what a mean on its own fails to say, and the answer is the whole reason dispersion exists. A mean of 7.2 hours is equally consistent with everybody sleeping about 7.2 hours and with half the school sleeping 5 and half sleeping 9. A measure of dispersion — standard deviation, range, interquartile range — is what tells those two schools apart. Name one, and say what it would add.
The standard score: a result measured in standard deviations (Q2, Q3)
A z-score answers a single question: how many standard deviations above or below its own mean does this result sit?
z = (x − x̄) ⁄ σ ⟺ x = x̄ + z·σThose are the same statement rearranged, and nearly every question is one of three directions through it. Writing the rearranged form before substituting is the habit that keeps them straight.
Three ways a z-score question is asked
Identify which of the three you are in, then substitute.
- 1Result given, z wanted
Subtract the mean first, then divide by the standard deviation — in that order. A negative answer is not an error; it means the result is below the mean, and its size still says how far below.
- 2z given, result wanted
Use the rearranged form: mean plus z times the standard deviation. A z of 0 returns the mean exactly, which is a useful sanity check on the arithmetic.
- 3Two results and their two z-scores given, mean and standard deviation wanted
Each pair gives one equation in the two unknowns. Subtract one equation from the other to eliminate the mean, solve for the standard deviation, then substitute back. Check with the equation you did not use to find the mean.
Why raw marks from two subjects cannot simply be added. This is the point of the scholarship question, and it is the sentence the mark is for. Two candidates can have identical raw totals and still not be equally strong, because a mark means something different in each subject. In a subject whose results are tightly grouped — a small standard deviation — being nine marks above the mean is a rare performance; in a subject whose results are spread out, the same nine marks are ordinary. Standardising puts both subjects on one scale before any comparison is made, and the answer should say which subject was tightly grouped and therefore why the same gap counted for more there.
One property worth knowing because it explains what standardising is for: adding the same amount to every result, or multiplying every result by the same positive number, leaves every z-score unchanged. The deviations and the standard deviation are stretched by exactly the same factor, so the ratio survives. A z-score measures position within the group, and that position does not depend on the units the group was measured in.
Voting procedures: the same ballots, different winners (Q4, Q5)
These questions look like counting exercises and they are really about one idea — a procedure is not a neutral way of reading the ballots, it is part of the decision. Each procedure reads a different piece of the same information.
The procedures, and what each one actually counts
Recount from the original table for every procedure. Never reuse the previous answer's totals.
- 1Plurality (relative majority)
Count first-place votes only; most wins. It ignores everything below the first line of each ballot, which is exactly why it can elect an option that most voters rank last.
- 2Absolute majority
More than half of the votes cast. State the threshold as a number before comparing — with 40 voters it is at least 21, not 20 — and then say whether the leader reaches it. This is a yes/no question, not a winner.
- 3Runoff
Keep the two options with the most first-place votes, then re-read every ballot and give it to whichever of those two it ranks higher. The ballots of an eliminated option do not vanish; they transfer, and they usually decide the result.
- 4Approval voting
Each voter ticks every option they find acceptable, and every tick counts. A voter contributes to several totals at once, so the totals need not add up to the number of voters — that is a feature, not a mistake in your arithmetic.
- 5Borda count
Points by rank — with four options, 3 for a first place, 2 for a second, and so on down to 0. Multiply each column of the ballot table by its number of voters. The check: the grand total of all points must equal the number of voters times the points available on one ballot.
The runoff is where the arithmetic goes wrong. Students carry the first-round totals forward and add the eliminated option's first-place votes to whoever seems closest. You have to look at the ballots: a voter whose favourite is eliminated supports whichever of the two survivors sits higher on their ranking, and a preference table tells you that exactly. Go through the table column by column and assign each block.
Q5 then asks what the club learns from the disagreement between plurality and approval, and that is the real question. Plurality measures the intensity of first preferences: it finds the option with the largest bloc of enthusiasts. Approval measures the breadth of acceptability: it finds the option the fewest people object to. An option can lead on one and lose badly on the other, and with more than two choices there is no reason for the two to agree. Neither is counting wrongly.
The synthesis question: three ways to rank, three answers (Q6)
Three finalists, two events with very different spreads, and three ranking methods — the sum of the raw results, the sum of the z-scores, and a points-by-rank scheme. They do not agree, and part (d) asks you to recommend one with a mathematical argument, which is where the marks are concentrated.
The argument for standardising is the one made above: adding raw results silently declares one point in the tightly grouped event to be worth one point in the widely spread one, and that is not true of the performances they represent. Standardising converts both to a common scale — distance from the mean measured in standard deviations — before adding, so a gap is weighted by how rare it is.
The argument against the points-by-rank scheme is worth stating separately, because it is a different weakness. Ranking within each event keeps only the order and throws away the size of the gaps, so an enormous margin and a margin of one point score identically. On this data that is precisely why it cannot separate the finalists at all. When you criticise a method, name what information it discards — that is what turns an opinion into an argument.
Preview all 4 pages
Click any page to open the full PDF.
Getting the most out of it
Write the formula rearranged before you substitute
Decide whether you are solving for z, for the result, or for the mean and standard deviation, and write that version of the equation on its own line first. Almost every z-score error is a substitution made into the wrong arrangement, not an arithmetic slip.
Recount the ballots for every procedure
Go back to the original table each time. The plurality totals are not an input to the runoff, the approval totals are not built from the first choices, and the points scheme uses the whole ranking. Carrying a number forward from the previous part is the fastest way to get three consistent answers that are all wrong.
Answer every "justify" with a number in the sentence
"No absolute majority, because the leader has 15 and the threshold is 21." "History is more tightly grouped, with a standard deviation of 4.8 against 6." A justification on this topic is a sentence containing a figure and a comparison — a vague sentence about it being fairer earns nothing.
Want the solutions, or something more challenging?
The worksheet, the questions above and every explanation on this page stay free permanently. Three more PDFs exist for this topic — the worked answer key, a harder problem set, and the answer key to that. They come with the Secondary 5 Math Solutions Bundle, which is what keeps the rest of the series free.
What else exists for Statistics
Three PDFs · 9 pages · all three are in the bundle below.
- Answer key — 2 pages. All 6 questions worked step by step, including the restrictions and the justifications. Not a list of final answers.
- Challenge problems — 5 pages, 6 problems. A separate sheet at exam-plus difficulty covering the same 3 concepts. Harder than anything on the free sheet.
- Challenge answer key — 2 pages. Every challenge problem worked to the same standard, with the checks shown.
- PDF, letter size, print-ready.
The one thing that's for sale
Every Secondary 5 Math topic — the complete Solutions Bundle
One download, one payment, the whole program. Every answer key and every challenge set for all 21 Secondary 5 Math worksheet sets — including this one.
- Worked solutions, not answer lists — every step written out
- Covers the whole year's program at this level
- Less than the price of one hour of tutoring — for the entire year's solutions
Taking Secondary 1 Math as well? The Secondary 1 Math bundle covers all 15 of its sets — 45 PDFs, 182 pages — on the same terms.
Taking Secondary 2 Math as well? The Secondary 2 Math bundle covers all 14 of its sets — 42 PDFs, 181 pages — on the same terms.
Taking Secondary 3 Math as well? The Secondary 3 Math bundle covers all 11 of its sets — 33 PDFs, 154 pages — on the same terms.
Taking Secondary 4 Math as well? The Secondary 4 Math bundle covers all 17 of its sets — 51 PDFs, 154 pages — on the same terms.
Taking CEGEP Calculus I as well? The CEGEP Calculus I bundle covers all 8 of its sets — 24 PDFs, 82 pages — on the same terms.
Taking CEGEP Calculus II as well? The CEGEP Calculus II bundle covers all 8 of its sets — 24 PDFs, 90 pages — on the same terms.
Taking CEGEP Linear Algebra as well? The CEGEP Linear Algebra bundle covers all 7 of its sets — 21 PDFs, 82 pages — on the same terms.
Taking AP Calculus AB as well? The AP Calculus AB bundle covers all 8 of its sets — 24 PDFs, 126 pages — on the same terms.
Common questions
Is this worksheet really free?
Yes — the questions are on this page to read, and the PDF downloads directly, no email and no account. The one paid item is optional: the complete Secondary 5 Solutions Bundle, which covers every set at this level.
What does a z-score of 1.5 actually mean?
That the result sits one and a half standard deviations above the mean of its own group. It says nothing about the raw mark on its own — a z of 1.5 can correspond to any number at all, depending on the group's mean and spread. A z of 0 is exactly the mean, and a negative z is below it.
Why can't I compare two subjects by just adding the marks?
Because the same number of marks means something different in each subject. Where results are tightly grouped, being a few marks above the mean is a rare performance; where they are spread out, the same gap is ordinary. Two candidates can have identical raw totals and very different standardised ones, which is exactly what the scholarship question is built to show.
How do I work out a runoff from a preference table?
Keep the two options with the most first-place votes, then go through the table column by column and give each block of ballots to whichever of those two it ranks higher — including the blocks whose favourite has been eliminated. Their votes transfer rather than disappear, and they normally decide the runoff.
Why do different voting procedures give different winners?
Because each one reads a different part of the same ballots. Plurality looks only at first choices and rewards the largest bloc of enthusiasts; approval voting counts every option each voter finds acceptable and rewards breadth; a points-by-rank count uses the whole ordering. With more than two options there is no reason for them to agree, which is why the procedure has to be chosen and announced before the vote — it is part of the decision.
What does stratified sampling protect against, exactly?
Against one subgroup being over- or under-represented by chance, because each stratum contributes in proportion to its size. That is all it guarantees. It does nothing about voluntary participation, about people answering untruthfully, or about non-response, so a stratified sample can still be biased for other reasons.
Can teachers use this in class?
Yes. Print and photocopy it for your own classes freely — I just ask that the tutorinmontreal.ca footer stays on the page.
I'm stuck on one question. Can you help?
Yes — through one-on-one tutoring, in Montreal or online. Get in touch to arrange a session, or see the current rates.
← All 21 Secondary 5 Math worksheets · Secondary 1 Math series (15 sheets) → · Secondary 2 Math series (14 sheets) → · Secondary 3 Math series (11 sheets) → · Secondary 4 Math series (17 sheets) → · CEGEP Calculus I series (8 sheets) → · CEGEP Calculus II series (8 sheets) → · CEGEP Linear Algebra series (7 sheets) → · AP Calculus AB series (8 sheets) →
The same topic at the other level: Secondary 4 Math · Statistics.